Observability & Telemetry
Grafana stack & Prometheus integration
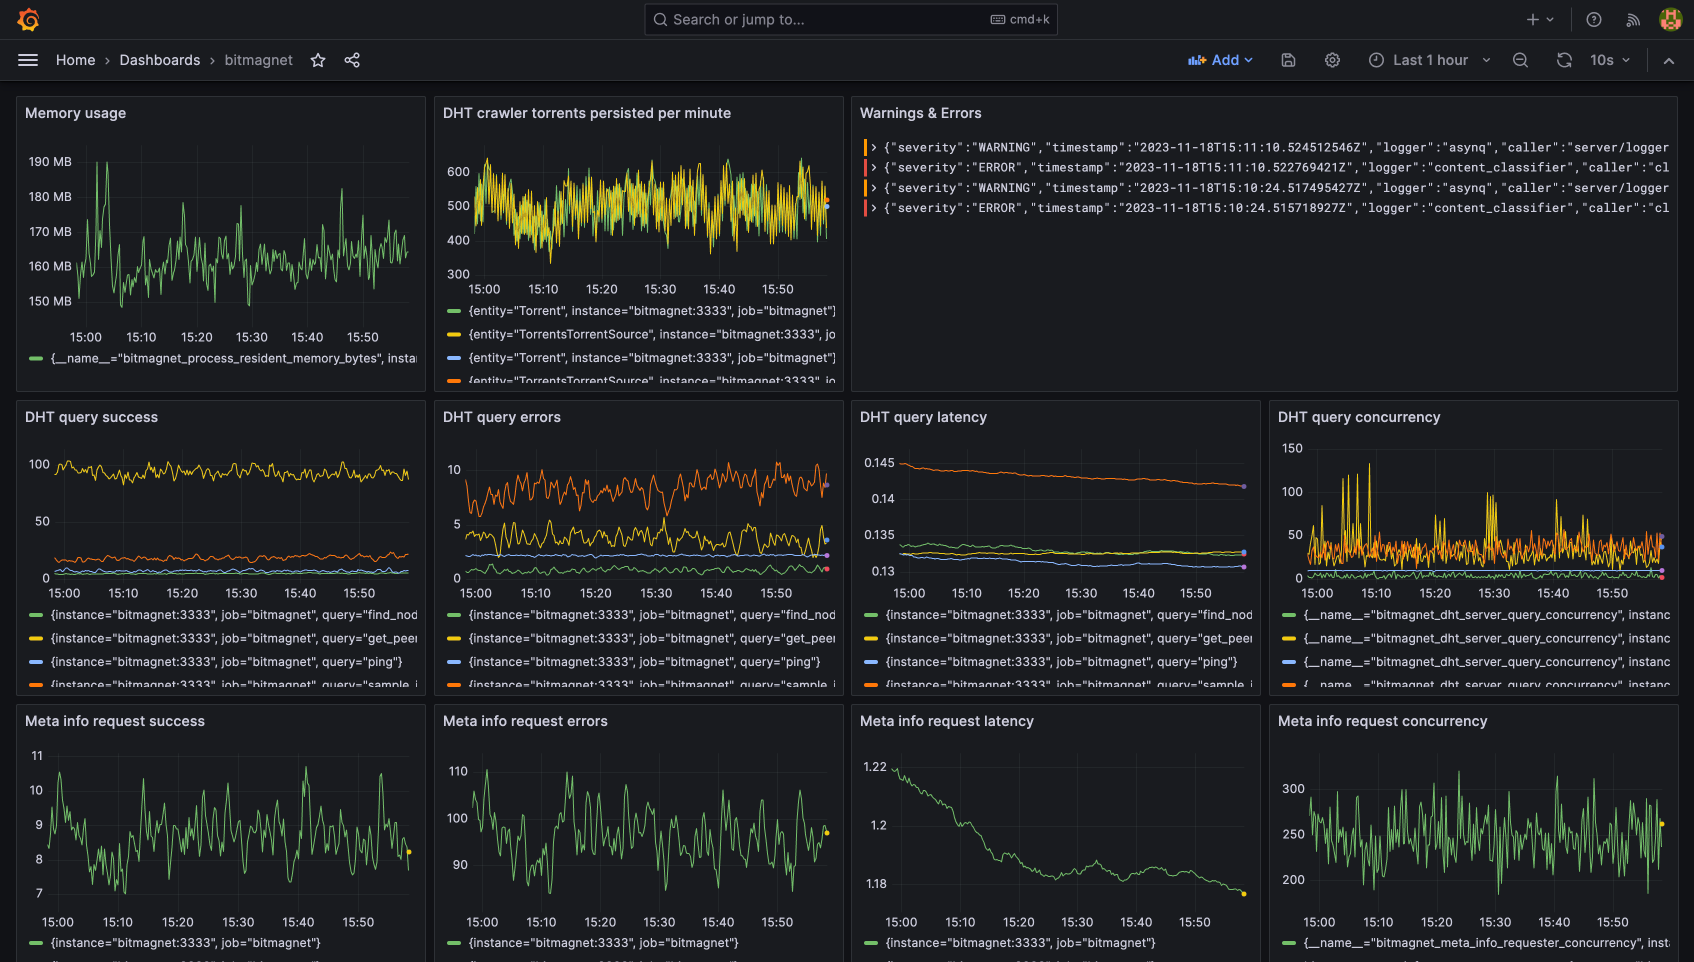
bitmagnet can integrate with the Grafana stack and Prometheus for monitoring and building observability dashboards for the DHT crawler and other components. See the “Optional observability services” section of the example docker compose configuration and example Grafana / Prometheus configuration files and a provisioned Grafana dashboard.

The example integration includes:
- Grafana - A dashboarding and visualization tool
- Grafana Agent - Collects metrics and logs, and forwards them to storage backends
- Prometheus - A time series database for metrics
- Loki - A log aggregation system
- Pyroscope - A continuous profiling tool
- Postgres exporter - Exposes Postgres metrics to Prometheus
Profiling with pprof
bitmagnet exposes Go pprof profiling endpoints at /debug/pprof/*, for example:
go tool pprof http://localhost:3333/debug/pprof/heap